© OpenStreetMap contributors © CARTO, © CARTO, © OpenStreetMap contributors © CARTO

Road

Daily motor vehicles, 2000

Daily motor vehicles, 2014

Percentage change

Change in motor traffic, 2000–2014
  • -50%
  • +5%

Islington Traffic Change, 2000–2014

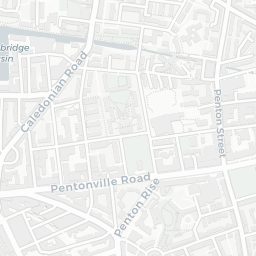
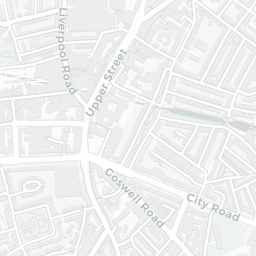
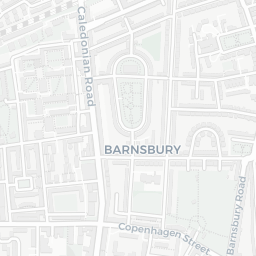
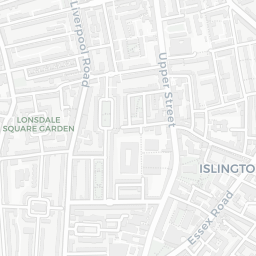
Where is traffic going down in Islington? Everywhere. DfT data

  • almost 10 years ago
More info

Datasets in use

  • london_borough_boundaries

    Boundaries for all 32+1 London boroughs. From here.

    Contains ONS & OS data © Crown copyright and database right (2015)

    public 33 rows almost 10 years ago
  • islington_traffic_counts

    DfT traffic counts from 64 roads in Islington, 2000–2014. (Source)

    public 960 rows almost 10 years ago

More from Nick Kocharhook